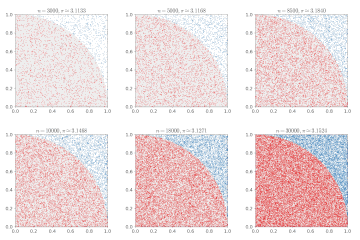
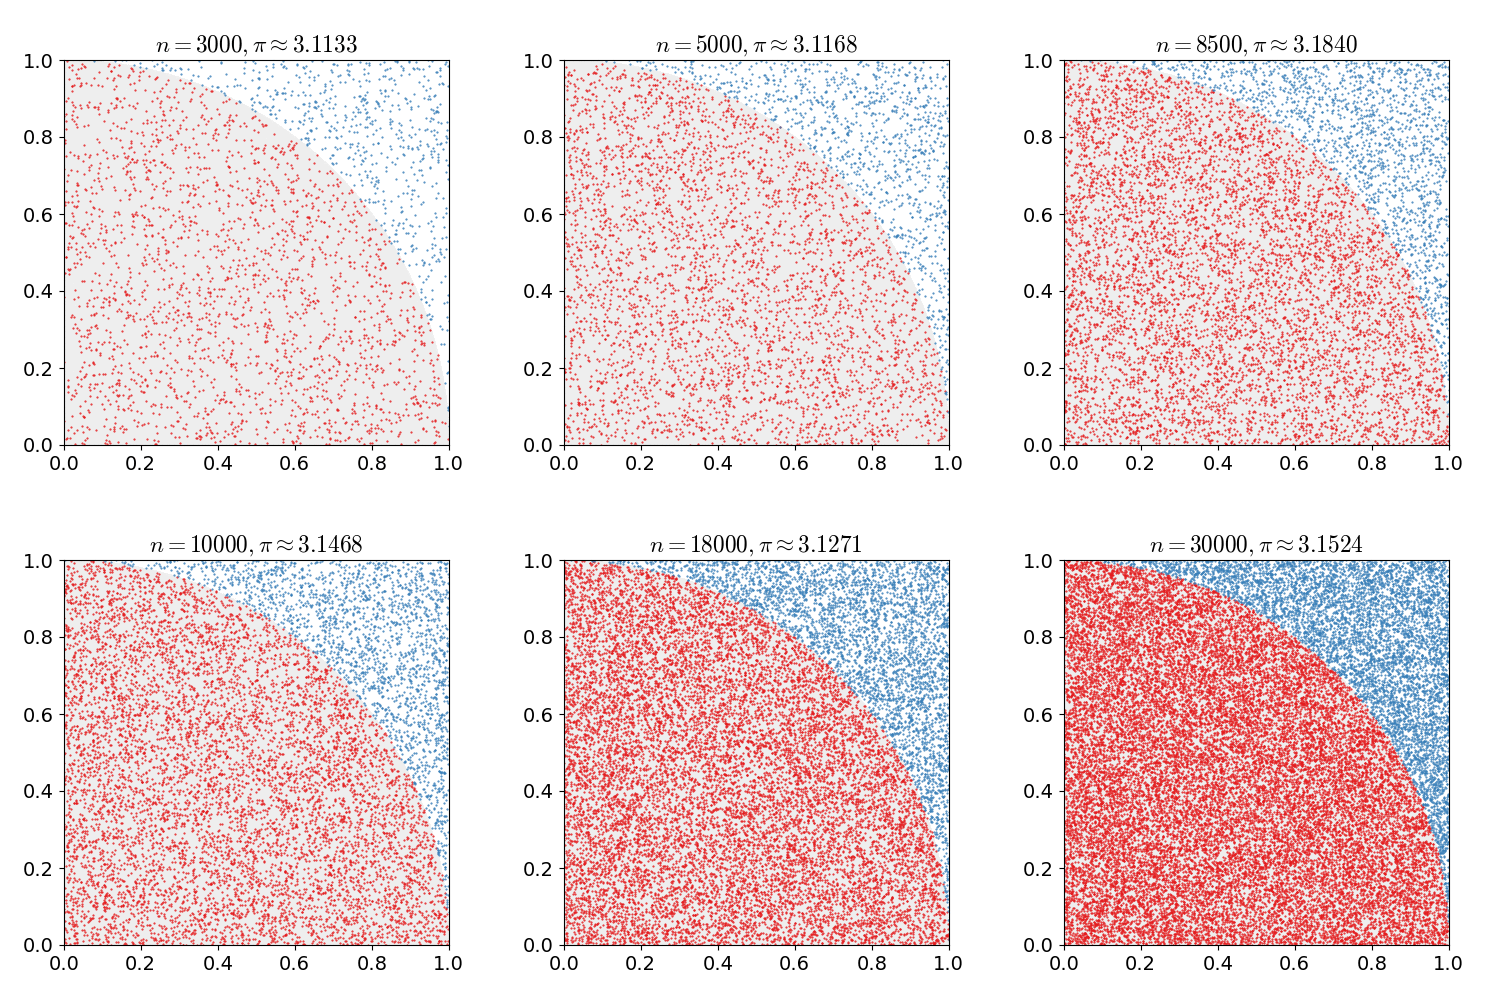
Файл:Pi 30K.gif
Pi_30K.gif (500 × 500 пікселів, розмір файлу: 476 КБ, MIME-тип: image/gif, кільцеве, 10 кадрів, 2,0с)
Історія файлу
Клацніть на дату/час, щоб переглянути, як тоді виглядав файл.
| Дата/час | Мініатюра | Розмір об'єкта | Користувач | Коментар | |
|---|---|---|---|---|---|
| поточний | 16:00, 16 лютого 2017 |  | 500 × 500 (476 КБ) | Nicoguaro | Make the plot square and increase gif delay. |
| 15:38, 16 лютого 2017 |  | 640 × 480 (476 КБ) | Nicoguaro | Bigger text in the axes, and colors from ColorBrewer. Code in Python. | |
| 18:29, 7 листопада 2011 |  | 500 × 500 (373 КБ) | Rayhem | Slowed animation to avoid looking like a blinky page element, improved resolution, added counter for number of points, shaded points inside/outside the circle. ==Mathematica 7.0 Source== <pre> tinyColor[color_, point_] := {PointSize[Small], color, Point[ | |
| 23:12, 14 березня 2011 |  | 360 × 369 (363 КБ) | CaitlinJo | {{Information |Description ={{en|1=As points are randomly scattered inside the unit square, some fall within the unit circle. The fraction of points inside the circle over all points approaches pi as the number of points goes toward infinity. This ani |
Використання файлу
Така сторінка використовує цей файл:
Глобальне використання файлу
Цей файл використовують такі інші вікі:
- Використання в ar.wiki.x.io
- Використання в be.wiki.x.io
- Використання в bg.wiki.x.io
- Використання в ca.wiki.x.io
- Використання в da.wiki.x.io
- Використання в el.wiki.x.io
- Використання в en.wiki.x.io
- Використання в en.wikibooks.org
- Використання в eo.wiki.x.io
- Використання в eu.wiki.x.io
- Використання в fa.wiki.x.io
- Використання в fr.wiki.x.io
- Використання в he.wiki.x.io
- Використання в hi.wiki.x.io
- Використання в id.wiki.x.io
- Використання в it.wiki.x.io
- Використання в ja.wiki.x.io
- Використання в ko.wiki.x.io
- Використання в pt.wiki.x.io
- Використання в sh.wiki.x.io
- Використання в simple.wiki.x.io
- Використання в sl.wiki.x.io
- Використання в sr.wiki.x.io
- Використання в sv.wiki.x.io
- Використання в ta.wiki.x.io
- Використання в test.wiki.x.io
- Використання в th.wiki.x.io
- Використання в tr.wiki.x.io
- Використання в vi.wiki.x.io
- Використання в www.wikidata.org
- Використання в zh-yue.wiki.x.io
- Використання в zh.wiki.x.io
